
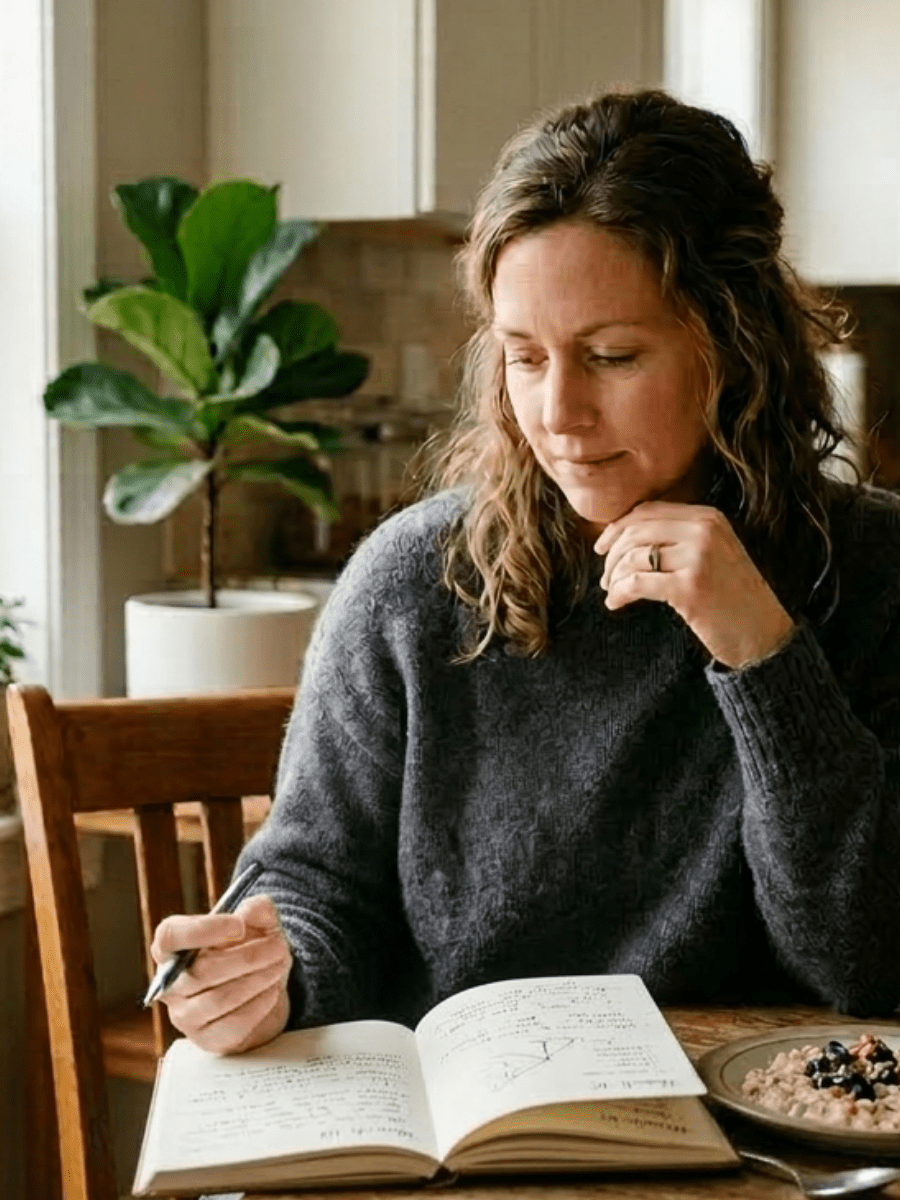
The Hidden Metabolic Pattern Behind Weight Loss Resistance
The Hidden Metabolic Pattern Behind Weight Loss Resistance Few things are more frustrating than feeling like you’re doing everything right — and still watching the
I’ve lost count of how many times I’ve heard, “But my fasting glucose is normal, so I’m fine, right?”
Maybe… but maybe not.
The truth is, your fasting glucose is just one snapshot. It’s like looking at a single still frame of a movie and trying to guess the entire plot.
The Oral Glucose Tolerance Test (OGTT), especially when paired with insulin levels, shows you the whole story — how your body actually handles sugar in real time.
If you’ve ever felt shaky, tired, or hungry after meals, or if your fasting labs look fine but something still feels “off,” this test might be the missing puzzle piece.
The OGTT measures how your body processes sugar over time.
Here’s what happens:
You fast overnight, have your fasting glucose (and sometimes insulin) checked, drink a sweet glucose solution (usually 75 grams), and then have your blood drawn at set intervals — typically at 1 and 2 hours after.
Think of it as a stress test for your metabolism — it’s watching how quickly your body can clear sugar and how hard your pancreas has to work to do it.
The standard OGTT measures only glucose.
The insulin-paired version adds another layer — it measures insulin levels at those same intervals.
That’s huge, because glucose alone doesn’t show the effort your body’s making to keep things normal.
Someone can have a “perfect” glucose curve… but sky-high insulin levels working overtime behind the scenes.
That’s early insulin resistance — and it’s reversible if you catch it early.
The OGTT can catch metabolic changes years before fasting glucose or A1c flag anything.
It helps identify:
Early insulin resistance (high insulin but normal glucose)
Reactive hypoglycemia (blood sugar crashes after a meal)
Gestational diabetes (in pregnancy)
Type 2 diabetes (when both glucose and insulin are elevated)
It’s one of the best ways to see how your body’s responding to real-world stress — food, hormones, and daily life.
And if you’ve ever been told, “Your labs look fine,” but you know your energy, cravings, or weight don’t match that… the OGTT can give you clarity.
Typical 2-hour OGTT glucose ranges (using 75g glucose):
| Test Time | Glucose (mg/dL) | What It Means |
|---|---|---|
| Fasting | <100 | Normal |
| 1 Hour | <180 | Normal glucose handling |
| 2 Hour | <140 | Normal |
| 2 Hour | 140–199 | Impaired glucose tolerance (prediabetes) |
| 2 Hour | ≥200 | Diabetes |
Now, if insulin is tested too, here’s what to look for:
| Test Time | Insulin (µIU/mL) | What It Means |
|---|---|---|
| Fasting | 2–8 | Optimal |
| 1 Hour | 30–60 | Normal response |
| 2 Hour | 20–40 | Returning toward baseline |
| >60 at 2 hours | Suggests insulin resistance |
⚠️ Note: Ranges vary slightly by lab. Always review your results in context — high insulin with “normal” glucose is still an early warning sign.
A few surprising things can throw off your results — or even mimic blood sugar issues:
Stress & cortisol: Chronic stress raises glucose and insulin.
Poor sleep: One bad night can spike next-day readings.
Diet before testing: Extreme low-carb or fasting diets can make results look worse than usual.
Hormonal changes: Menstrual cycle, PCOS, or perimenopause can alter glucose tolerance.
Illness or inflammation: Even a cold can change insulin sensitivity temporarily.
Medications: Steroids, birth control, and thyroid meds can affect readings.
The goal isn’t perfection — it’s understanding how your body actually responds.
Balancing blood sugar doesn’t mean cutting out every carb — it means working with your body’s natural rhythms.
Here’s what helps most:
Start meals with protein or fiber. It slows the sugar response.
Move after eating. A 10-minute walk lowers glucose and insulin naturally.
Get sunlight in the morning. It helps regulate circadian rhythm — and blood sugar.
Prioritize sleep. Insulin sensitivity improves overnight.
Manage stress. Cortisol spikes are often the first domino to fall.
Don’t under-eat. Restrictive dieting can raise cortisol and worsen insulin resistance.
Small, sustainable shifts can change your whole glucose curve — and how you feel every single day.
Join me on my journey to a healthier lifestyle

Want to take an OGTT without waiting for an appointment? Here are trusted options:

Provides 2-Hour Glucose Tolerance Tests with optional insulin testing add-ons through local draw sites.

Offers a Glucose Tolerance Test (GTT) that measures how your body processes sugar over a two-hour period, helping identify early signs of insulin resistance and glucose imbalance — ideal for a deeper look beyond fasting glucose..
Affiliate Disclaimer: Some of the links above are affiliate links, meaning I may earn a small commission if you purchase through them—at no extra cost to you. I only share lab options I genuinely trust and would recommend to my own patients, friends, and family.
If your OGTT shows higher insulin or glucose levels than expected — don’t panic.
It’s information, not judgment.
It means your body’s been working overtime, and now you know how to help it rest and rebalance.
✨ Grab my free “What Spikes Me?” Workbook to track how your meals, stress, and sleep affect your glucose.
✨ Download the Sustainable Habits Guide to support insulin sensitivity through simple, consistent routines.
✨ Book a free 60-minute consultation — we’ll go over your labs together and build a plan that fits your lifestyle (and your sanity).
American Diabetes Association. Standards of Medical Care in Diabetes.
Mayo Clinic. Glucose Tolerance Test Overview.
NIH. Insulin Resistance and Glucose Testing.
The Hidden Metabolic Pattern Behind Weight Loss Resistance Few things are more frustrating than feeling like you’re doing everything right — and still watching the

The 5 Lab Patterns I See Most Often in Women with Chronic Fatigue Introduction One of the most common things I hear from women is:

Labs Tell a Story — But Only If You Know How to Read the Pattern Many women come to health conversations carrying the same confusion:
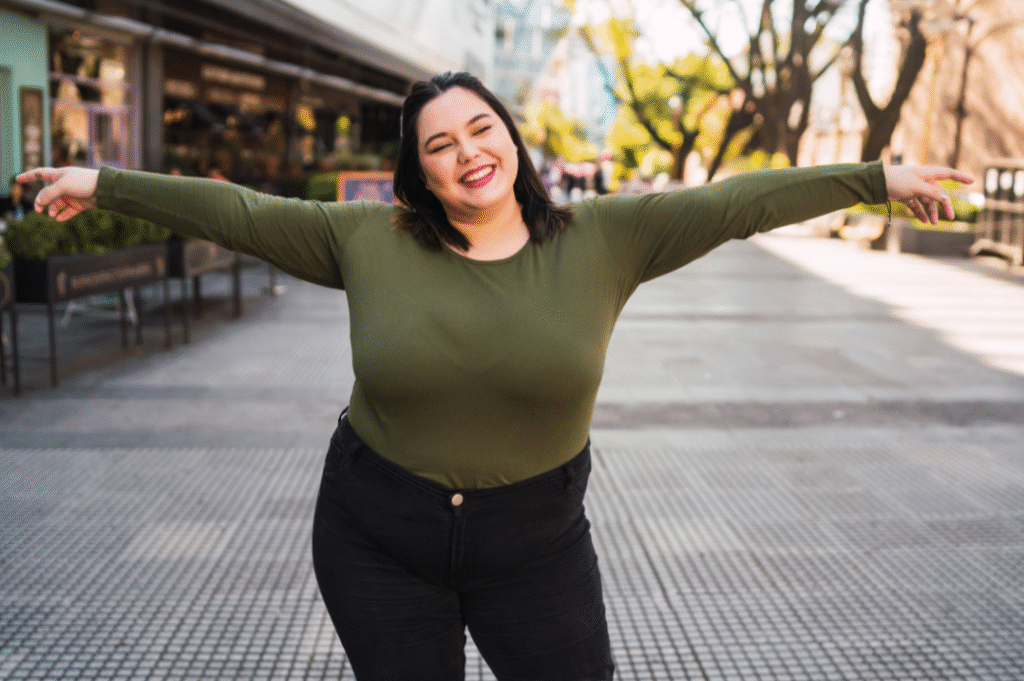
If you’re tired of the endless cycle of dieting and conflicting health advice, feeling overwhelmed and longing to truly understand how to nourish your body and feel good in your own skin like I did, you’re in the right place. Through my blog, I share insights on weight loss, mindset, neuroplasticity, nutrition, and self-care to empower you on your wellness journey. Whether you’re seeking personalized guidance to address specific health challenges or you’re ready to break free from restrictive diets and embrace body acceptance while achieving sustainable weight loss, I offer coaching programs designed to help you cultivate lasting health and body confidence. Ready to explore a different path?
One-on-one sessions tailored to your health history, goals, and lifestyle—rooted in nursing expertise and current wellness science.
Guided coaching to help reframe limiting beliefs around food, body image, and health—so you stop sabotaging your progress.
Practical tools, customized strategies, and compassionate support to help you take consistent, manageable steps forward.
“Working with Rebecca completely shifted my mindset.”
I had tried everything—diets, workout programs, you name it—but nothing ever stuck. Rebecca showed me how to reframe my beliefs about food and my body. I’m losing weight without trying to lose weight!
“I finally feel in control of my health for the first time in years.”
Rebecca didn’t just focus on my symptoms—she really listened to my story and helped me understand the root of my challenges. Her guidance was practical and tailored to me, and now I feel empowered to make choices that support my health every day.
“Rebecca’s support made all the difference.”
Having someone who understands both the medical side and the emotional side of health was a game-changer for me. Rebecca provided me with actionable steps, encouragement, and accountability every step of the way. I can’t recommend her coaching enough!

Book a no-pressure session where we’ll talk about your health goals, struggles, and what’s been holding you back. You’ll walk away with clarity—even if you don’t sign up.
Based on your unique history and needs, I’ll create a personalized plan—no generic advice here. You’ll get clear next steps, ongoing support, and a roadmap that fits your life.
With consistent guidance and mindset shifts, you’ll feel more in control of your health, more confident in your choices, and more connected to the person in the mirror.

Personalized 60-minute sessions tailored to your unique health goals, lifestyle, and challenges.

A roadmap designed just for you—no generic advice, just focused guidance based on your needs and medical background.

Worksheets, journaling prompts, and reflection exercises to help you stay mindful and motivated between sessions.
We’ll track what matters most to you—from energy to mindset to symptom relief—so you can see real growth.

Break free from old patterns and build new habits with a focus on lasting behavior change—not quick fixes.

Stay connected with check-ins and direct access to me for questions, encouragement, and clarity when you need it.
You don’t have to figure it out alone. Whether you’re managing a chronic condition or tired of the constant struggle with weight and self-doubt, support is here.